
SEO is one of the integral parts of a website, and its troubleshooting has to be done time-to-time. It needs different tools and toolkits for troubleshooting, and one of the essential toolkits here is the Chrome DevTools.
Chrome DevTools allows an SEO services professional to spot-check underlying SEO issues – from crawlability to performance. Chrome DevTools is one of the most reliable tools to automate audits or diagnose SEO issues at scale and also allows crucial ways to spot-check the issues on the go.
In this article, I would be sharing some of the different used cases which differ from the normal ones where SEO pros can rely on the DevTools.
If you are new at setting up the Chrome DevTools, accessing it is as simple as right-clicking a webpage and jump onto the inspect option.
Clicking Inspect means you are into the Elements panel that will give you a glimpse of the DOM and style sheet used for comparing the page. The Elements panel alone offers plenty of things to look into. However, to take full advantage of the toolkit, it is necessary to enable the console drawer. To get into the console drawer, click the three dots next to the setting icon and select Select Console Drawer.
Now, with both the console drawer and the element panel enabled, users, can get a glimpse of the code. This code will be rendered in the DOM. Also, you will get to see the style sheets that are being used to paint the code in the browser. The console drawer may also show the console, depending on how frequently you use DevTools. Moving ahead, let us now focus on three additional tools,
Under the More Tools section, select each of the tools mentioned above until they appear as tabs in the console drawer.
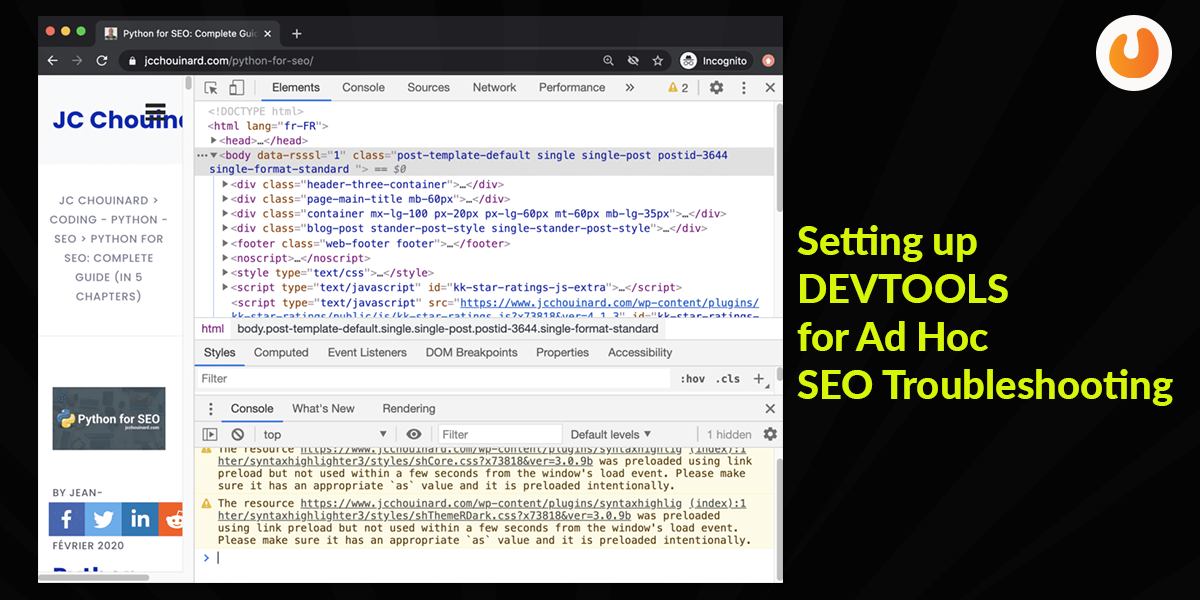
Now, the DevTools panel may look something like this,
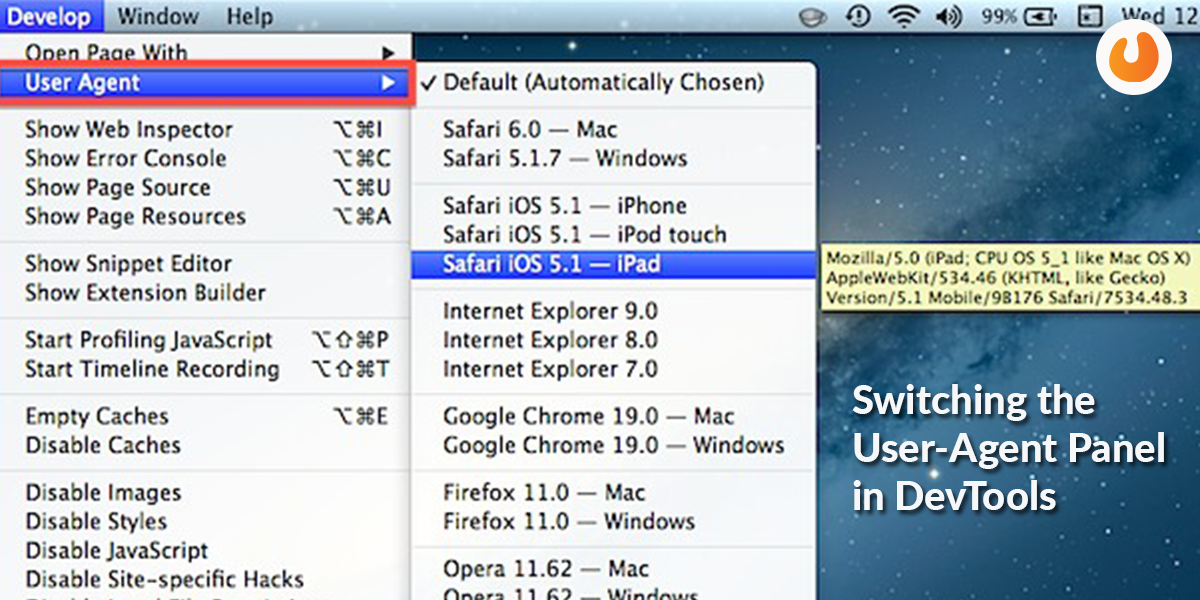
People generally overlook this, but the fact is one of the best ways to use DevTools is by leaning on Chrome’s built-in ability to switch User-Agent.
This step has helped in revealing various issues by providing insight into how Googlebot is seeing and processing the information on a particular site.
Also, Read – What Is The Need Of A Website Redesign With SEO
An SEO agency treats DevTools as a trusty magnifying glass allowing users to zoom in on a particular issue to uncover a root cause.
How to switch Your User-Agent: To switch your user-agent in Chrome, use the network conditions tab in the console drawer.
Here, untick Select automatically and view the content using Googlebot Smartphone, Bingbot to see how the content is being delivered.
Spotting overzealous server protection: There are many hackers available on the web, and generally, malicious miscreants may try to use the power of Google against a particular site.
If you somehow see a message like the one given below, then it’s an alarming sign for some testing.
Mobile alternate site: Mobile sites are more in demand nowadays. Go for a website for mobile-first indexing where Google may not be showing the updated title tag or meta description in SERPs.
It may be difficult to determine why Google has chosen another title or failed to update the title in SERPs from a previous title tag. Mobile sets are not a thing of the past as they still exist.
Diagnosing core Web Vitals in DevTools: The Performance tab is also one of the most important tabs in DevTools. It is a gateway for troubleshooting issues that relate to page speed and performance. Also, it can offer some actionable takeaways when it comes to Core Web Vitals. All these metrics are a part of Google’s Core Web Vitals have been a part of page speed and performance reports. Therefore, SEO professionals need to be familiar with truncating these issues. To understand these Web metrics better, the Performance tab in DevTools is important.
You must have come across soft 404s in SEO audits. The soft 404s are when the browser may show a 404 page but return a 200 OK response code.
Sometimes, the content is loaded, exactly what is expected on the browser, but still, it shows a 404, 302, or generally incorrect or different than what is expected.
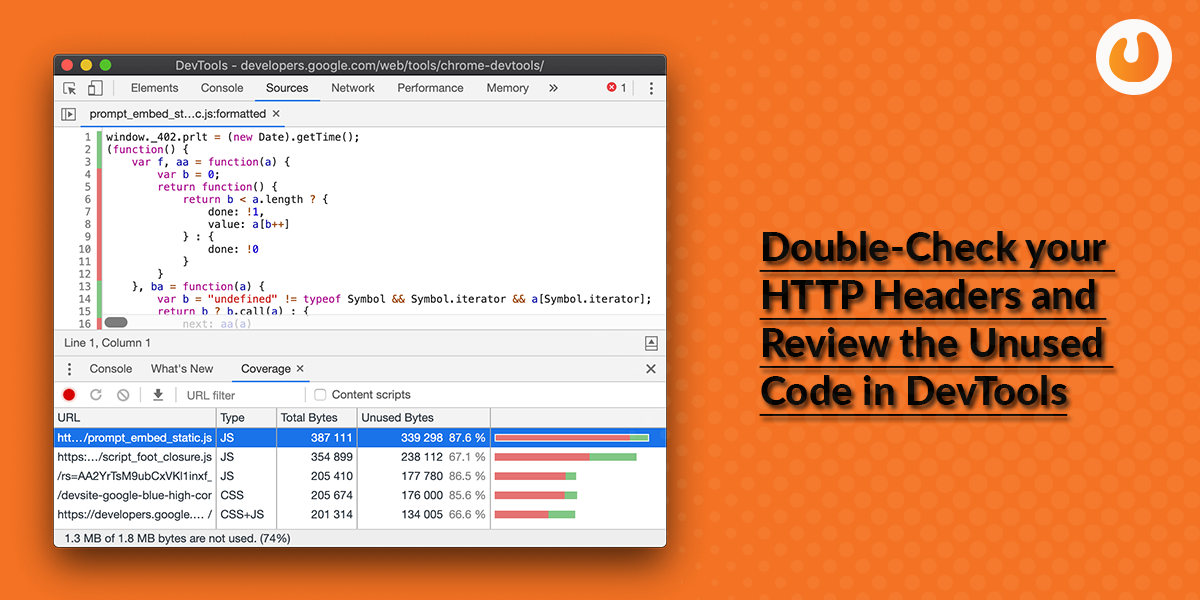
There are also a host of Chrome Extensions that gives you information about the response codes. Something that you can check straight from DevTools. There are two steps involved in this,
First, the filetype filter at the top of the Network tab. -This allows us to narrow our focus to specific content types.
Once you have selected a resource, the Headers sub-menu in the Network tab allows seeing a host of information regarding the selected file.- This includes the information related to the HTTP header including, the Request method, Request URL, Status Code, Content-Encoding, Last-Modified date, server, and much more. All this information is vital while troubleshooting. You can rely on this information to,
Time to wrap up: DevTools remain a critical part of a technical audit and should be implemented correctly for better results. With speed being the most prominent part of DevTools, SEO professionals can feel empowered to determine check issues from crawlablity to performance.